Search Projects
National IVF Policy Simulator
Simulates long-term economic impacts of custom IVF funding policies in different countries
Guppy: Event Sharing and Discovery
Social platform enabling memorable experiences through event discovery, sharing, and rating
Smart RSVP Tracker
Streamline event registrations and track guest attendance with validation and live updates
Customer Checkout Workflow
Simulating real-world retail and wholesale checkout workflows with customer logic
Reducing Participation Inequality
Market analysis and benchmarking competitive metrics to aid marketing strategy
Crypto Clustering
Predicting price change effects on cryptocurrencies through unsupervised ML
To Fund or Not To Fund?
Predicting organization success to inform a nonprofit's funding strategy
The Daily Commute
Mapping post-pandemic Citi Bike travel patterns across New York City
Unicorns Do Exist
Analyzing and mapping the top startup ecocystems around the globe
The Vacation Planner
Pulling global weather and hotel data to help you plan your next big trip
Engagement Analytics
A comprehensive analysis on event engagement to increase client satisfaction
A Credit Risk Predictor
Forecasting borrower creditworthiness to inform lending strategy
It's Raining in Hawaii
Exploring annual precipitation patterns in Hawaii to aid travel planning
National IVF Policy Simulator
Across the world, fertility rates are declining and aging populations and rising, leaving countries with a critical challenge: strained labor forces and public finances. Policymakers are increasingly considering whether subsidizing or partially/fully covering in-vitro-fertilization (IVF) could help reverse this trend, along with other initiatives meant to lower the financial burden of childcare. Today, IVF in particular remains inaccessible for many couples and families due to high out-of-pocket (OOP) costs, despite its potential to boost fertility rates. To determine the best approach to expanding access and utilization, governments (and their respective public health, labor, economic planning, and national insurance departments) need a data-driven way to understand (1) who would benefit from public IVF coverage, (2) what the financial and demographic outcomes would be, and (3) whether such a policy aligns with national economic and fiscal objectives. The National IVF Funding Policy Simulator is an interactive application that evaluates how expanding IVF access can affect a nation's population, workforce, and economy in the long run. It models IVF utilization, live birth outcomes, and downstream fiscal effects (GDP, tax revenue, dependency ratio) under different funding scenarios.
Dashboard
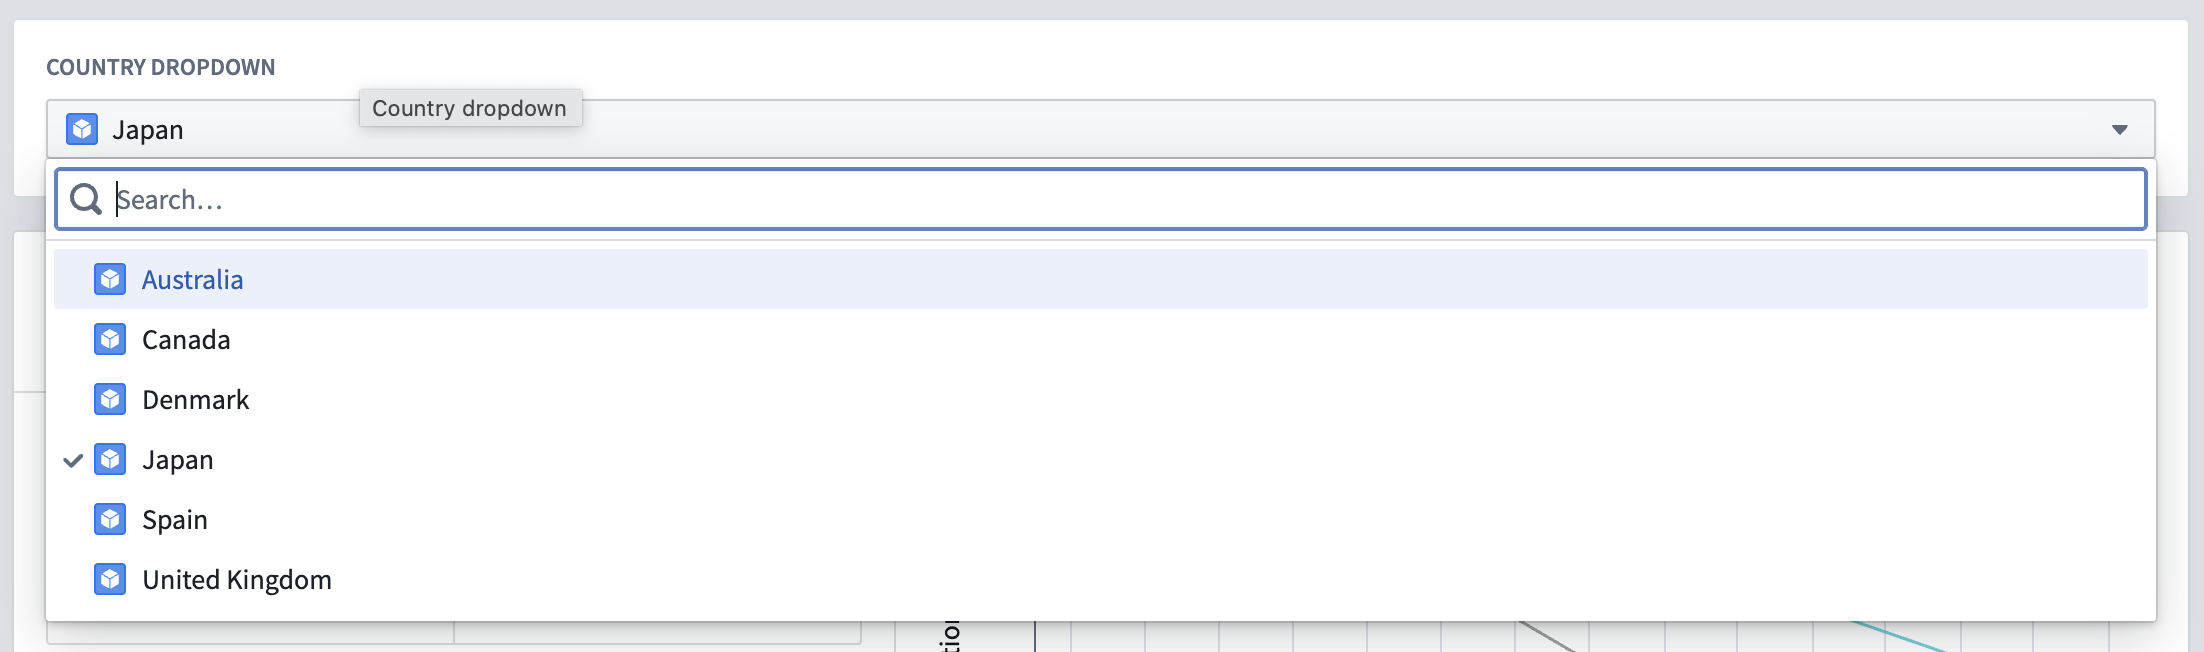
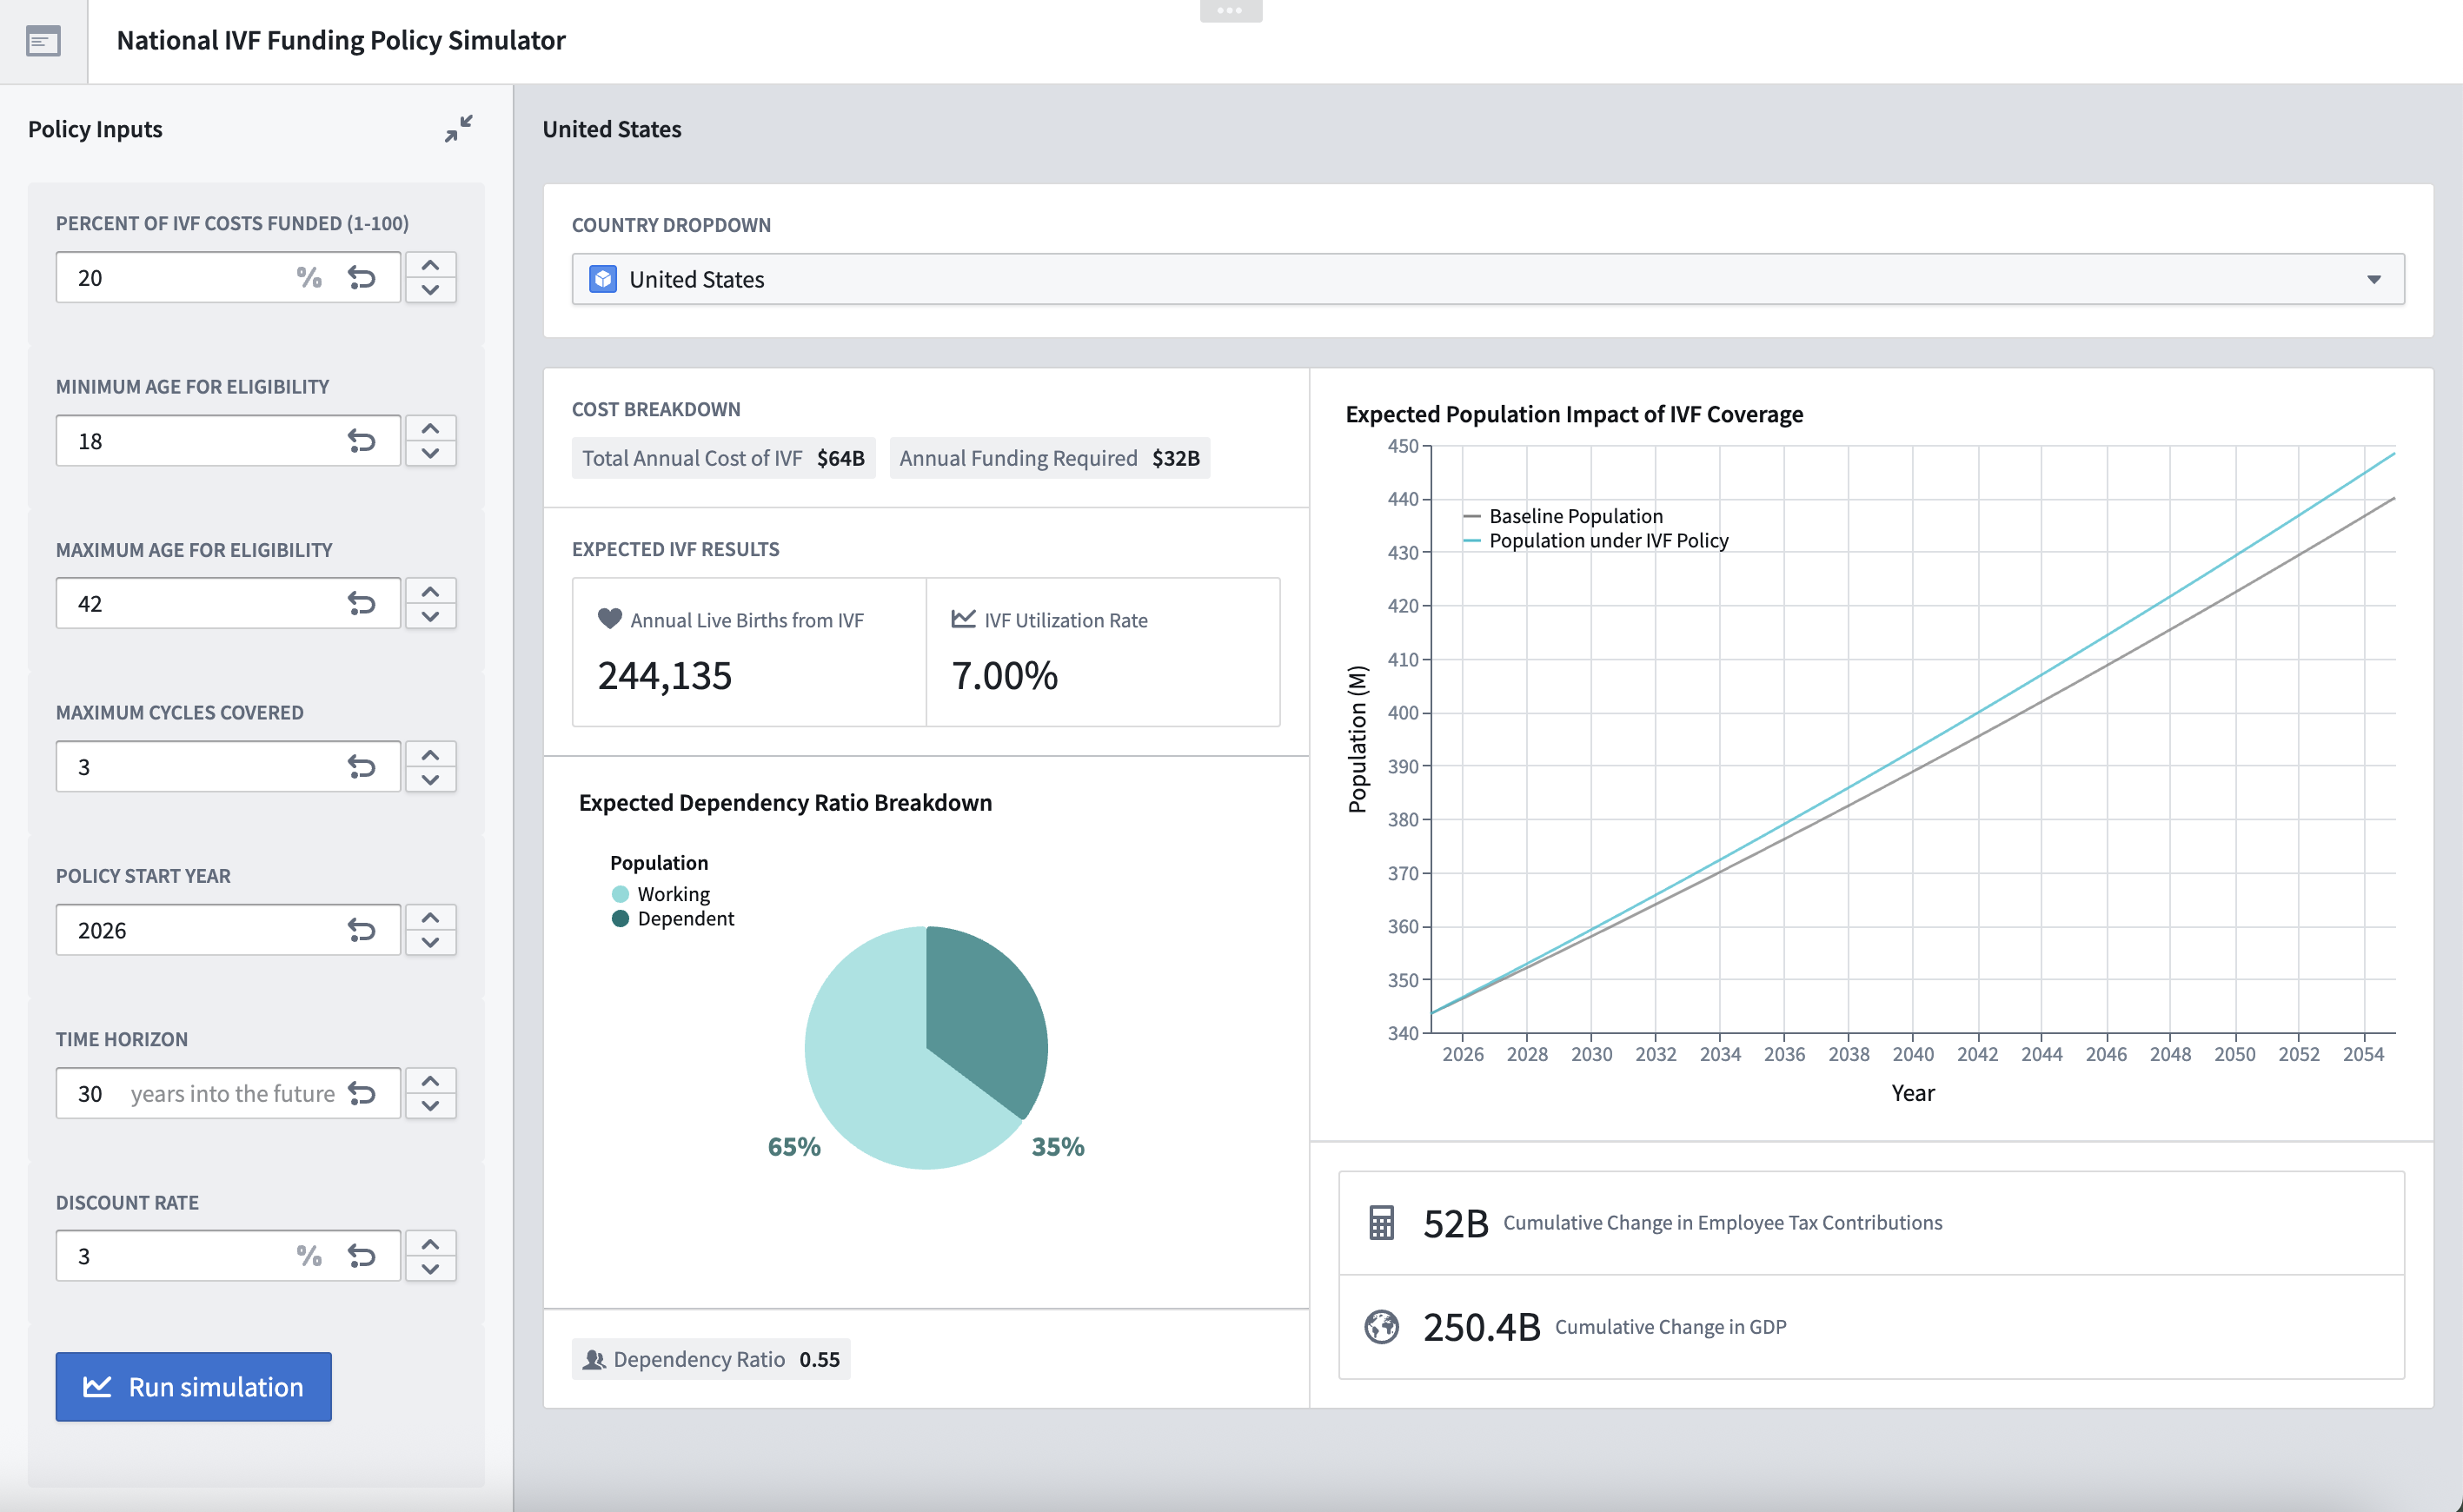
A user can simulate the impact of a custom IVF funding policy in any of the available countries by adjusting any of the default policy inputs. Below is a simulated dashboards for a policy in the United States. The results account for the long-term economic impact of IVF-born babies, who are expected to eventually enter the workforce and contribute back to the nation's economy through tax revenue and GDP. This simulator essentially provides insight on whether a funding amount is enough to make a sufficient impact on population growth, and/or if one is committing to an amount that is over a given budget.
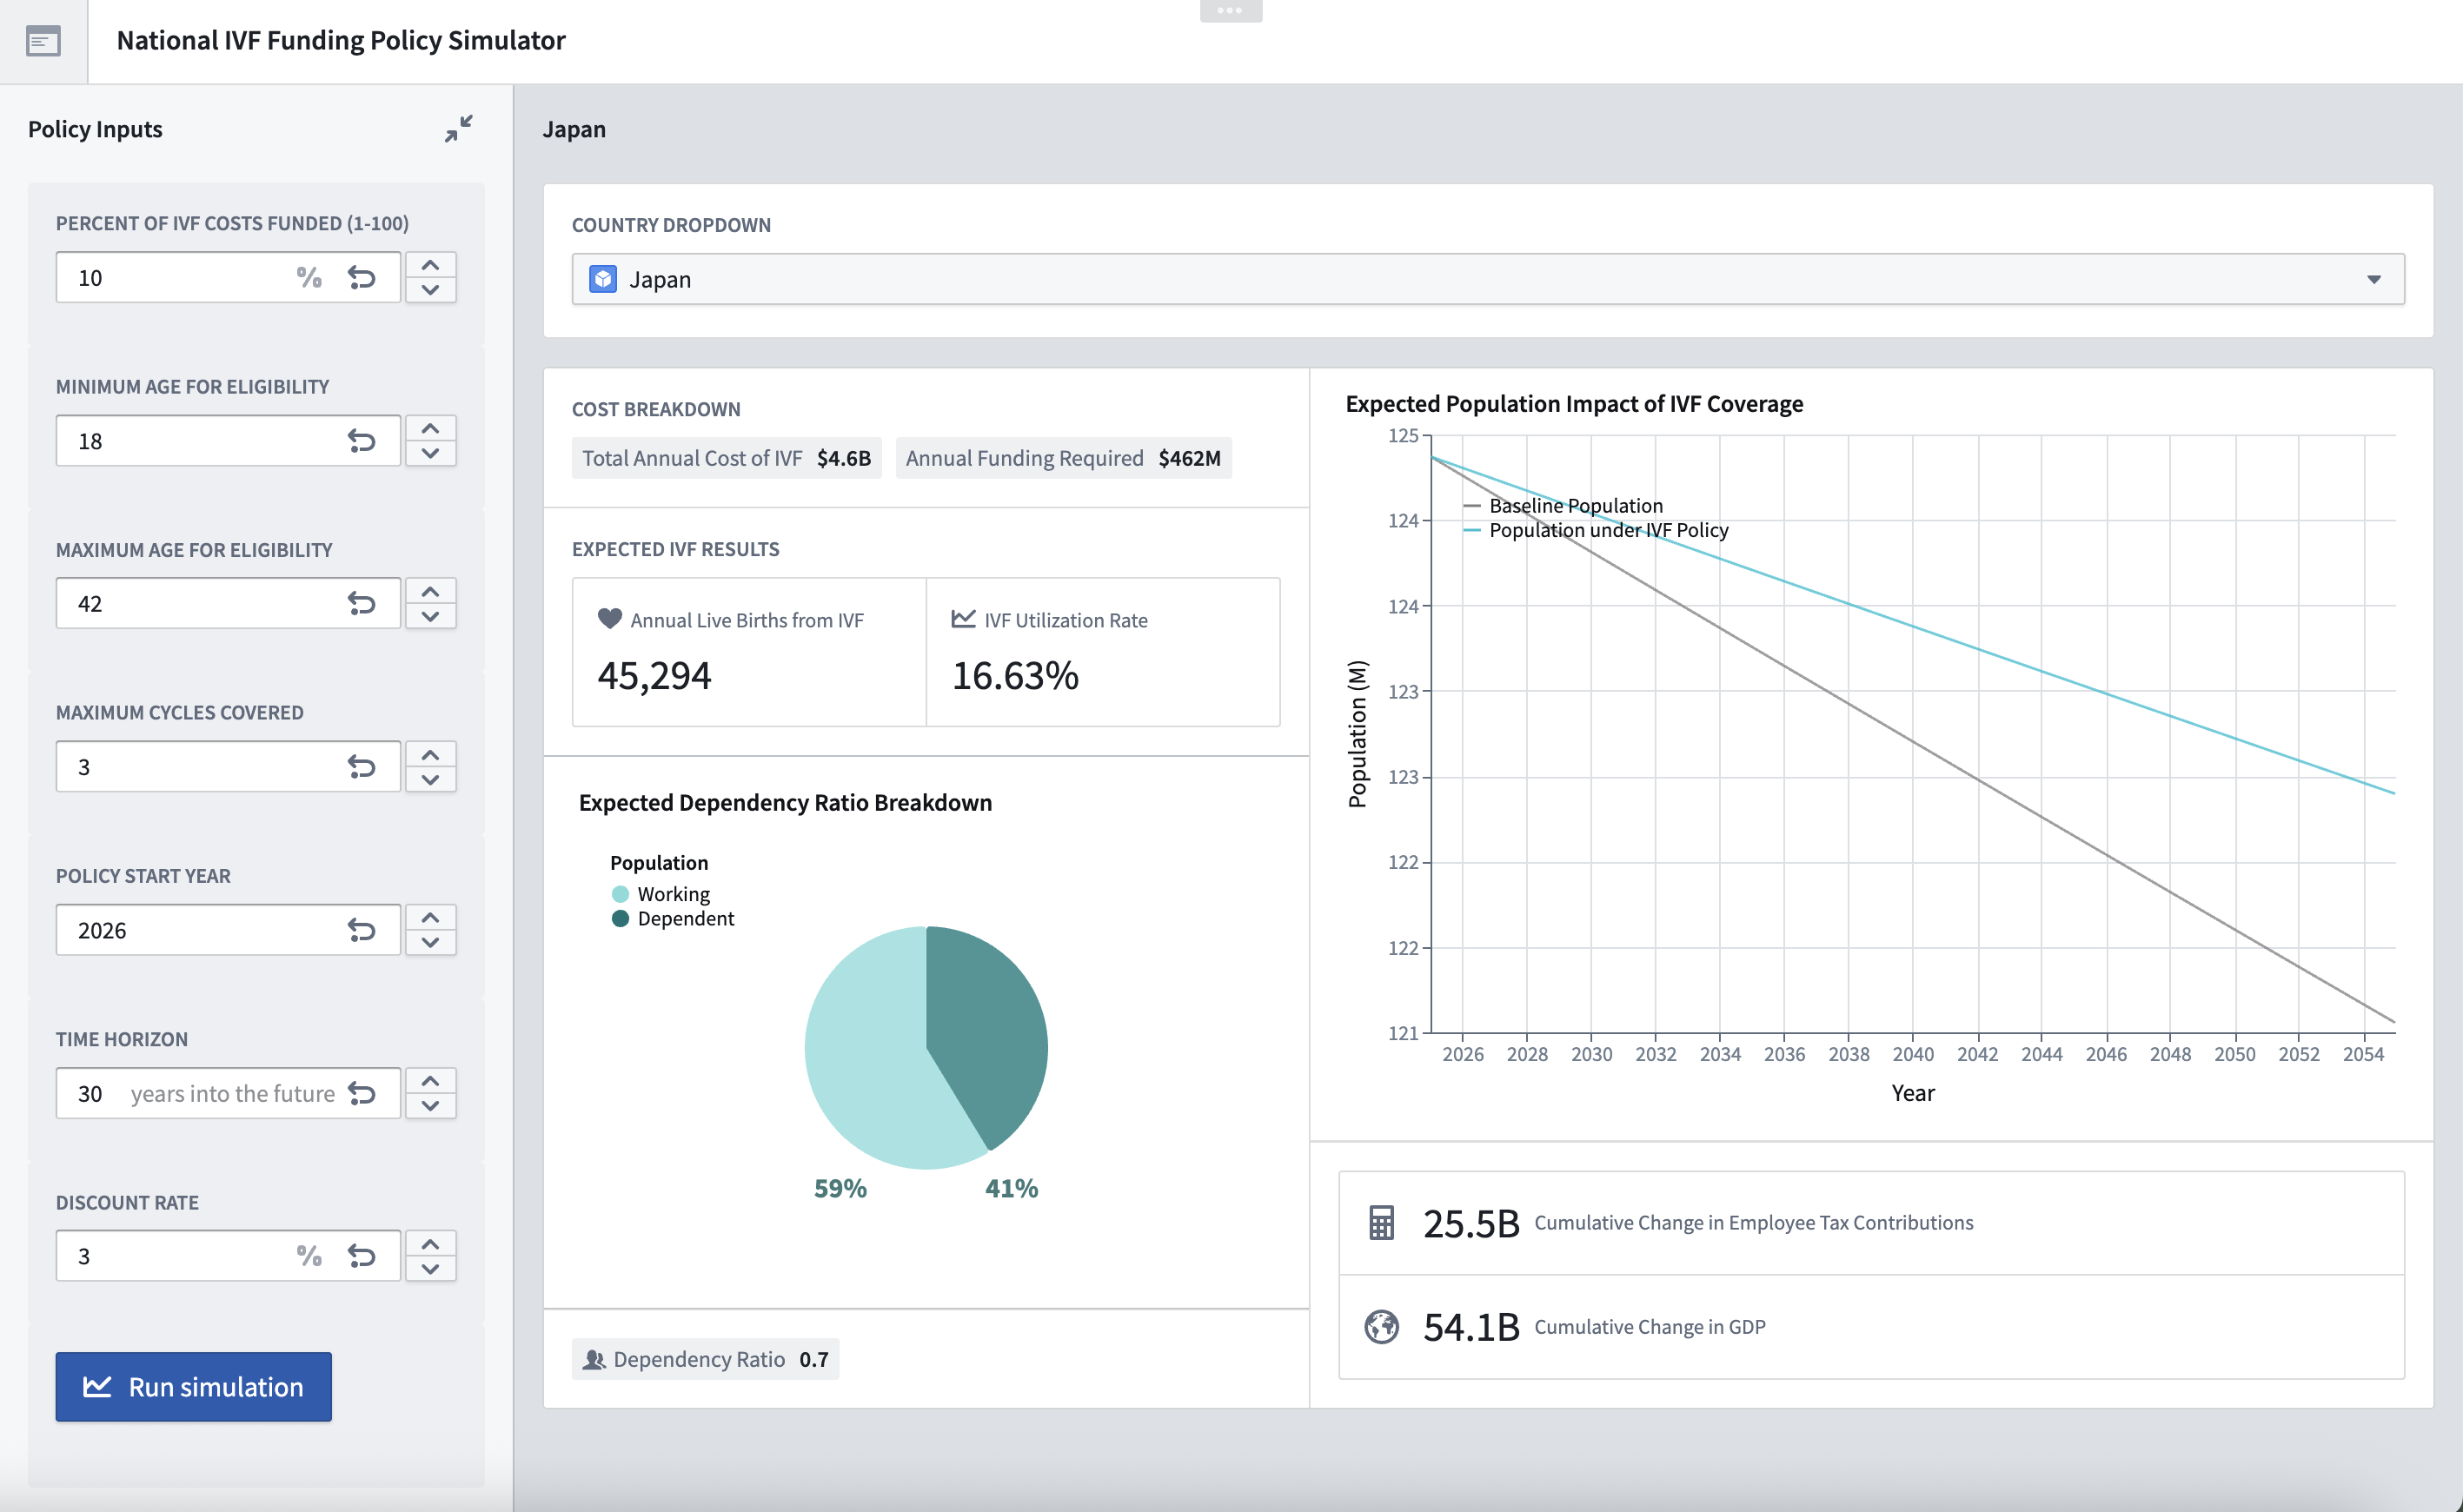
To contrast, here is a simulation of a different policy in Japan, which has been experiencing a signfiicantly rapid population decline over the past 20 years.
Data Pipeline
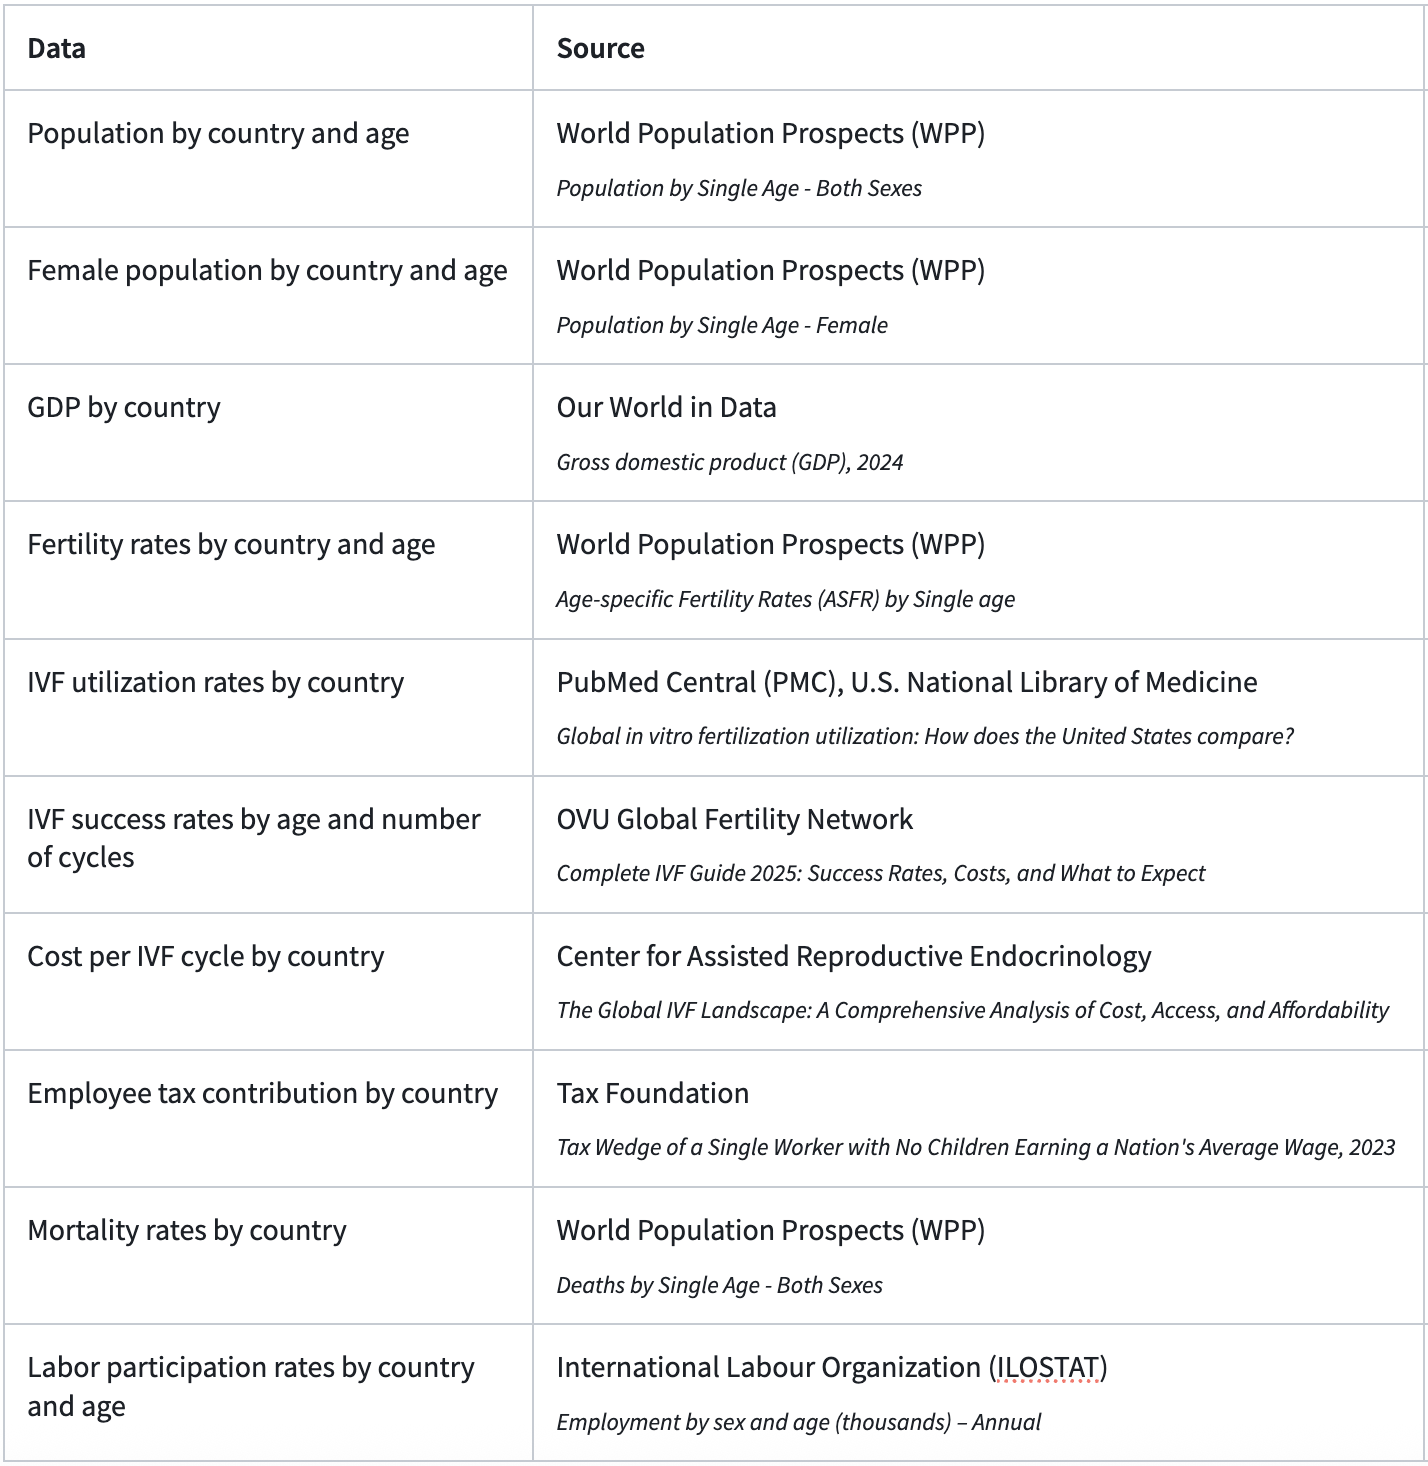
This workflow ingests demographic, economic, and fertility data from a collection of sources, listed and hyperlinked below. With expanded permissions within the platform, this pipeline can easily be scaled to ingest data through APIs and/or web scraping.
Projection Functions
Key functions calculate IVF success rates, live birth outcomes per year, population projections, dependency ratio, projected worker populations, and cumulative GDP and tax deltas. An AI logic function was also developed to predict a future IVF utilization rate based on price elasticity, fertility rates, and other socioeconomic factors, providing a baseline for the above calculations. All functions are parameterized for user inputs – percent covered by funding, minimum and maximum eligibility ages, maximum number of cycles covered, policy start year and time horizon, and discount rate.
Assumptions
Given time and resource constraints, this model serves as a simplified representation of a much more complex system. A few key assumptions were made to enable rapid prototyping and development: (1) For every 1% change in out-of-pocket cost, demand changes by 1.32% (2) Annual population growth and mortality rates and discount rates remain constant over time (3) IVF policy shock is applied as a constant number of additional births per year (4) And baseline numbers are pulled from 2023, the most recent year with complete data available.
Next Steps
This simulation currently provides a simplified framework for understanding the demographic and fiscal impacts of IVF coverage policies. It assumes that many external factors – such as fertility and mortality rates and macroeconomic conditions – remain constant over time, and it isolates IVF access as the primary intervention influencing birth rates. However, with more comprehensive data sets and feedback from policymakers, it can be scaled to sufficiently address a wider range of factors in more regions of the world.
Code
This project was built on Palantir's Foundry & AIP platform.